
What Is Trap Bias in Greyhound Racing?
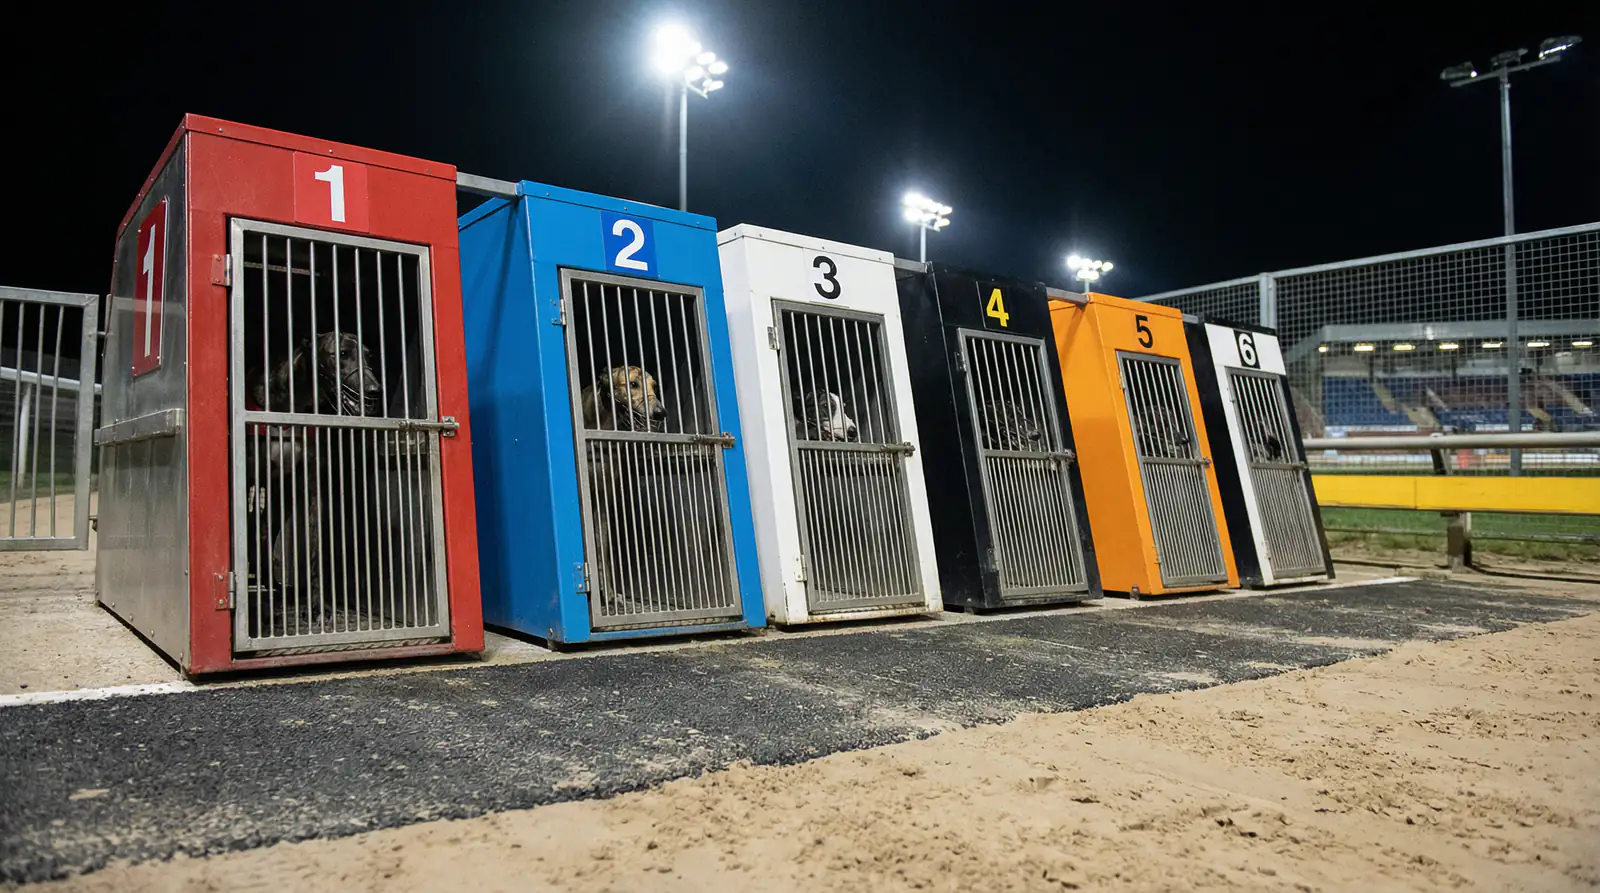
In UK greyhound racing, every dog starts from a numbered trap — Trap 1 on the inside rail, Trap 6 on the outside — and the starting position has a measurable effect on winning probability. This effect is trap bias. It exists because the physical geometry of a greyhound track — the circumference, the bend radius, the angle from trap to first bend, and the camber of the racing surface — creates structural advantages for dogs drawn in certain positions, independent of the individual dog’s speed or form. At some tracks and distances, those advantages are marginal. At others, they are large enough to materially shift your assessment of any given race.
Trap bias is not a hidden variable that only experts know about. It is documented in the form data, discussed on Racing Post’s greyhound section, and factored into the odds to varying degrees by bookmakers. The key word is “varying.” Where trap bias is most consistently underpriced by the market — either because it has changed recently due to track maintenance, or because the data for a specific distance and grade is thin — is where the analytical punter finds an edge. Understanding trap bias starts with understanding why it develops, which is a function of the track’s physical characteristics rather than any intentional design.
How Trap Bias Develops at UK Tracks
A greyhound race begins with six dogs breaking simultaneously from the traps and converging on the first bend within roughly two to three seconds. The dog drawn in Trap 1 — on the inside rail — has the shortest distance to travel to that first bend. All else being equal, a dog with average early pace in Trap 1 will reach the bend position before an identical dog drawn in Trap 6, because it travels a shorter arc. The inside dog is also better positioned to maintain the rail for the rest of the race, which on a true oval provides a permanent marginal advantage in terms of total distance covered.
But track bias is not simply about which trap is closest to the rail. It is about which trap, at a specific track and specific distance, produces the best statistical winning rate across a sufficient sample of races. And this changes depending on several factors. The track surface condition — going described as good, fast, or slow — affects which running styles benefit from the draw. The course of the first bend determines how much advantage the inside traps carry. Some tracks have notoriously tight first bends that funnel traffic and punish wide runners; others have sweeping bends where a wide-drawn dog with good early pace can cross to the rail without being boxed out.
Track maintenance also shifts bias over time. Re-grading of the surface, resetting of the rail position, or changes to the inside running line can alter bias that was clearly established in the data. A track where Trap 1 had a documented advantage through the winter season may show neutral or even reversed bias after resurfacing in spring. This is one reason why trap bias data should be drawn from recent samples — the last 30 to 90 days at the specific track and distance — rather than from historical averages that span multiple seasons and track conditions.
The distance also matters. A 400-metre sprint is won primarily in the first bend — which means the draw has maximum influence. At longer distances, pace and stamina become more important relative to position, and the draw’s effect diminishes. Bias data is therefore most useful, and most reliable, on sprint distances where the sample sizes are largest and the first bend’s influence on the outcome is unambiguous.
Trap Win Rates: UK Track Data
The most reliable source for trap win rate data is the Racing Post greyhound statistics section, which aggregates results by track, distance, and trap across multiple timeframes. For any GBGB-licensed track with a meaningful sample of races, the percentage of wins from each trap is available — and the divergences from a neutral 16.7% baseline (the expected win rate if all traps were equal in a six-runner field) reveal the operational bias at that track.
Historical patterns across UK tracks show some consistent themes, though these should always be verified against current data. Romford, a right-handed track with a relatively tight configuration, has historically shown a meaningful advantage for Trap 1 at its standard sprint distance. The inside rail position suits the track’s first bend in a way that right-handed ovals often amplify. At a national level, the aggregate advantage of Traps 1 and 2 across all GBGB tracks tends to exceed a neutral distribution, simply because the majority of UK tracks are oval and the inside advantage is a structural feature of the format.
| Track | Direction | Trap 1 Win % | Trap 6 Win % | Bias Tendency |
|---|---|---|---|---|
| Romford | Right-handed | ~20–24% | ~11–14% | Strong rail bias |
| Wimbledon | Right-handed | ~18–22% | ~13–16% | Moderate rail bias; wide runners competitive |
| Crayford | Right-handed | ~19–23% | ~12–15% | Rail bias on sprints |
| Monmore | Right-handed | ~18–21% | ~13–16% | Moderate rail bias |
| Hall Green | Right-handed | ~17–20% | ~13–16% | Slight rail bias |
These figures are indicative ranges based on historical GBGB data and are subject to variation with track conditions and surface changes. Always verify against current Racing Post trap statistics before placing. The table is a starting point for analysis, not a static reference.
A divergence of 6–8 percentage points between Trap 1 and Trap 6 win rates — common at right-handed oval tracks on sprint distances — is operationally significant. In a six-runner race with four genuine contenders, a Trap 1 dog that the market has priced at 2/1 against a Trap 6 dog at 5/4 may actually represent better value than the fixed-odds prices suggest, if the empirical trap advantage at that specific track tips the probability calculation toward the inside-drawn runner. This is the basic mechanism through which trap analysis translates into betting value.
Rail Runners vs Wide Runners
Beyond raw trap win rates, the individual dog’s running style is the other half of the draw equation. A natural rail runner — a dog that instinctively tracks the inside line through the bends — benefits disproportionately from Trap 1 or Trap 2, where the starting position puts it in immediate contact with the rail without the need to cross field. The same dog, drawn wide in Trap 5 or Trap 6, faces a difficult early race: it must either cross to the rail, exposing itself to traffic from other runners, or run wide throughout, covering extra distance and fighting the bias.
A wide runner, by contrast, can thrive from the outside traps. These are dogs that naturally drift toward the middle and outer lanes through the bends, where they avoid the traffic that typically concentrates on the inside. A wide runner in Trap 6 on a track with a sweeping first bend — one where the outer lane is not a significant disadvantage in distance terms — may actually have a cleaner run than the same dog trapped inside and forced to navigate a crowded rail.
Form cards on Racing Post’s greyhound section typically record a dog’s running style, and the pattern of previous results across different trap positions provides the best evidence of whether a particular dog is a confirmed rail runner, a natural wide runner, or a versatile animal that handles any draw. Dogs that have won or placed from multiple trap positions across different tracks tend to be less sensitive to the draw. Dogs with a strong record from specific positions and a weak record from others are draw-dependent — backing a confirmed rail runner from Trap 5 or Trap 6 is often a bet you can construct a clear case against, regardless of what the win odds say.
Using Trap Data in Your Betting Decisions
Trap bias data becomes a productive tool when it is used to refine a view you already have, not to generate selections in isolation. The workflow is: start with the form — which dogs are genuinely competitive on the basis of recent runs, grade, and distance — then apply the trap analysis to sharpen the assessment of which dogs in the competitive group have a positional advantage in this specific race at this specific track.
Two specific applications are most useful. First: in a competitive race where two dogs of similar ability are drawn in very different traps, the trap data can justify backing the inside-drawn dog at a price that underestimates the structural advantage. If both dogs have near-identical recent form but the market treats them identically despite one being drawn in Trap 1 and the other in Trap 5 at a track with documented rail bias, the inside dog is underpriced. Second: when a strong form horse is drawn in a disadvantageous trap for its running style, the trap analysis can support betting against it or at least avoiding it as a banker in combination bets — the expected superiority based on form will be partially offset by the positional disadvantage.
The sample size required to trust trap data is important. For a busy BAGS track running three or four meetings per week, 90 days of sprint results will produce 200 or more data points across six traps — enough to identify a meaningful statistical pattern. For a smaller track with fewer weekly meetings, the sample may be thinner and the figures less reliable. In those cases, extending the timeframe to six months while checking for any recent track maintenance that might have shifted conditions is the appropriate adjustment.
The most common mistake with trap analysis is treating it as deterministic. A Trap 1 dog with a 22% historical win rate at a given track does not win 22% of every race — the rate is an aggregate across a wide range of race qualities and field compositions. In any individual race, the form, grade, and competition matter more than the trap. What the bias data gives you is a marginal edge in probability assessment, not a mechanical selection system.
The Draw Is Your Starting Point, Not Your Answer
Trap bias is one of the most reliably quantifiable variables in greyhound racing, which makes it more useful than most analytical tools available to the retail punter. Unlike pace ratings or trainer patterns — which require significant data gathering and interpretation — trap win rates are directly observable from public race results and updated continuously as racing continues.
But it is a starting point. The draw tells you which position is structurally favourable at a given track and distance. The form tells you which dog has the ability to take advantage of it. The going, the grade, and the specific competition tell you how open the race is. A dog drawn perfectly in Trap 1 at a track with strong rail bias but outclassed by four of its rivals is still a losing selection — the positional advantage is real but insufficient to compensate for the raw ability gap. The trap is the frame. The dog has to fill it.